FULL-FUNNEL MANAGEMENT · FLAGSHIP
Compare Your Channels. Move Every Dollar to What Wins.
For founders running spend across Google, Meta, and Microsoft who still can’t compare them. One team runs your ads and the analytics beneath them, every channel measured the same way, so you finally see where the next dollar earns the most. Get clarity on how things stand.
The three channels sit on one scorecard with their cost per lead and ROAS. Budget flows into each channel as a stream. Move budget with the sliders: the blended cost per lead and ROAS update, and the winner is the channel with the lowest cost per lead and the highest ROAS.
One dashboard · every channel, measured the same way
COST / LEAD$38.84
ROAS3.25x


THE REAL PROBLEM
You can’t compare channels you measure differently
Most companies run Google through one vendor, Meta through another, and Microsoft as a forgotten import, each with its own tracking. So the numbers never reconcile, and budget gets allocated on gut.
The numbers never agree
Each channel reports differently and none matches the bank. There’s no single read on what actually drives revenue.
You can’t tell which channel wins
Three dashboards, three definitions of a conversion. So you can’t say where the next dollar should go.
Budget is stuck in silos
Spend is locked per channel and per vendor, instead of flowing to whatever is winning this month.
Everyone blames everyone
The media buyer blames the pixel, the analyst blames the buyer, and the vendors blame each other.
OUR APPROACH
We unify the measurement first. Then the comparison is real.
The 3-Pillar Method™ runs across your whole stack, not one channel at a time.
One Measurement Layer
Server-side, CAPI, UET, offline and CRM imports, one BigQuery warehouse, so Google, Meta, and Microsoft are all measured the same way. This is what makes them comparable.
Pillar 1 · The unified wedge
Channel Structure
Each channel rebuilt for its own strengths, not lazy-imported, and structured for profitable, controllable scaling.
Pillar 2 · Built per channel
Creative & Message
Creative and message-market match tuned per platform, because what wins on Meta isn’t what wins on Search.
Pillar 3 · Per platform
WHAT’S INCLUDED
The whole stack, run as one engine
- One unified measurement layer across Google, Meta & Microsoft
- One Data Studio dashboard: CPL & ROAS comparable across channels
- Full-funnel coverage: prospecting, nurture, capture & cross-channel retargeting
- Server-side, CAPI, UET, Enhanced Conversions & offline/CRM imports
- Cross-channel budget allocation toward whatever wins
- Enterprise decision-intelligence layer (attribution + predictive)
- Event Map — every conversion, every channel, documented
- Quarterly strategy & growth reviews
Why each channel earns its place
Google: measured on revenue, not clicks. Every dollar tracked end to end across Search, Shopping, and PMax.
Meta: fed clean server-side data so it optimizes on real conversions post-iOS, paired with creative that converts.
Microsoft: run first-class, not a leftover import, with LinkedIn company, industry, and job-function targeting for cheaper, higher-intent reach.


What You Get
Compare, allocate, scale
One source of truth
Every channel measured the same way, with cost per lead and ROAS side by side, reconciled with the bank.
Budget that follows winners
Move spend toward whatever is winning this month, across channels, because for the first time you can actually see it.
One engine, not three silos
One accountable team running the ads, the tracking, and the numbers, with no finger-pointing.
Why a Partner
nn.partners vs the typical multi-vendor setup
The realistic alternative is a patchwork of single-channel vendors plus a separate analytics resource. Here’s the difference.
Scope
nn.partners
✓ All channels AND analytics, one roof
- Typical multi-vendor setup
- ✗ One vendor per channel; tracking is your problem
Measurement
nn.partners
✓ One unified layer across Google/Meta/Microsoft
- Typical multi-vendor setup
- ✗ A different setup per channel, numbers never reconcile
Comparison
nn.partners
✓ CPL & ROAS comparable across channels
- Typical multi-vendor setup
- ✗ Siloed screenshots you can’t compare
Budgeting
nn.partners
✓ Move budget to whatever wins
- Typical multi-vendor setup
- ✗ Stuck in silos, allocated on gut
Method
nn.partners
✓ One 3-Pillar Method™ across the stack
- Typical multi-vendor setup
- ✗ Set-and-forget tweaks, no shared method
Accountability
nn.partners
✓ One team, one source of truth
- Typical multi-vendor setup
- ✗ Vendors blaming each other
Access
nn.partners
✓ The strategist who owns the whole stack
- Typical multi-vendor setup
- ✗ Three junior reps across three vendors
- $10M+managed across channels
- 1source of truth, every channelunified measurement
- 7 figuresadded for clients in 2024
Who Runs Your Stack
One team owns the ads, the tracking, and the numbers
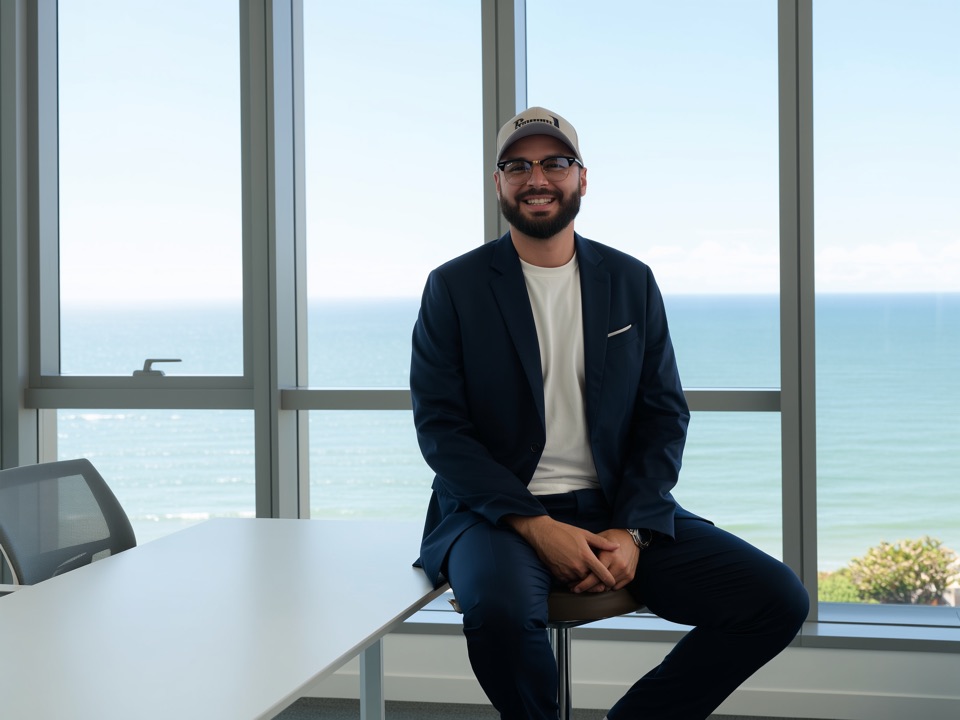
No more a media buyer who blames the pixel, an analyst who blames the buyer, and three vendors who blame each other. Your whole stack is run by Nik Vdovenko, founder, with 9 years and $10M+ in managed spend. You work directly with the strategist who owns every channel and the measurement beneath them.
- One teamAll channels, no finger-pointing
- Founder-ledSenior attention, no handoff
- 9 yrs · $10M+Across channels & continents
- Request auditGet clarity before you commit
How It Works
Get clarity before you commit
Request Full-Funnel Audit
We review every channel, the tracking beneath them, and where attribution and budget are leaking across the funnel. No obligation.
Build & Unify
We unify the measurement layer, rebuild each channel for its strengths, and connect it all into one dashboard. Request an audit; get clarity on how things stand and areas of growth.
Manage & Allocate
Ongoing management across the funnel, moving budget to whatever wins, with one source of truth you can trust.
Client Stories
Leaders who finally see the whole picture
“He’s been invaluable in not only running our ad campaigns, but also helping improve our overall reporting and business model.”
Martin OchwatPartner, Dundas Insurance
“Our business grew exponentially.”
Leo VorontsovFounder & CEO, Contractors Intelligence School
“They genuinely care about getting the best outcome for clients and go above and beyond.”
Matt WoodHead of Digital, Karman Digital
FAQ
Questions multi-channel founders ask
Per-channel agencies each optimize their own silo and none of them see the whole picture, so budget gets defended instead of allocated. We run Google, Meta and Microsoft off one tracking setup and one P&L view, so money moves to wherever it’s actually working.
Every platform reports conversions differently and double-counts. We feed them all from one server-side source tied to real revenue, so a lead from Meta and a lead from Google mean the same thing. Then you can compare them honestly.
Google, Meta and Microsoft as the core, plus YouTube where it fits. We start with the channels your buyers actually use, not a checklist.
By what closes, not by what platforms claim. Once everything reconciles to revenue, the answer is usually obvious, and we shift spend toward the channels and campaigns carrying their weight.
One view across every channel that ties spend to closed revenue, not platform-reported conversions. You stop reconciling three dashboards that disagree and start making decisions.
It can, or it can extend one. We’re a small senior team plus specialists, so you get the strategy and the hands without the headcount. Plenty of clients keep us as their whole paid-media function.
Tracking and structure get fixed in the first weeks, and that alone usually surfaces wasted spend fast. The compounding gains come over the following months as better data feeds better decisions.
It scales with how many channels you run, so we price it after the audit. Request an ads audit; get clarity on how things stand and areas of growth.
Let’s grow together
One team. Every channel. One source of truth.
Your ads and analytics across Google, Meta, and Microsoft, measured the same way, so you can finally compare them and put every dollar where it wins.
- 3Channels, one team
- $10M+Ad spend managed
- 9 yrsPaid media & analytics
- RequestFull-funnel audit