Every Ad a Customer Clicked Before Buying

 Plays from YouTube, which may set cookies.
Your Attribution Superpower: BigQuery Sees the Path, Server-Side Tagging Keeps It Whole
Ad platforms and web analytics each give a sale to one touch, usually the last click. Customers take several, across search, social, the website and the phone. For one client, we put every real new customer’s order from July to September 2026 into BigQuery next to everything that customer did before it: every visit, ad click, form and call.
| New customers’ orders, Jul to Sep 2026 | Basic web analytics setup | Advanced BigQuery setup |
|---|---|---|
| All orders: with a known source | 59% | 86% |
| All orders: path shows 2+ channels | 14% | 45% |
| All orders: touches per path | 2.1 | 3.9 |
| Web orders: with a known source | 79% | 90% |
| Web orders: path shows 2+ channels | 19% | 49% |
| Phone orders (one in four): with a known source | 0% | 75% |
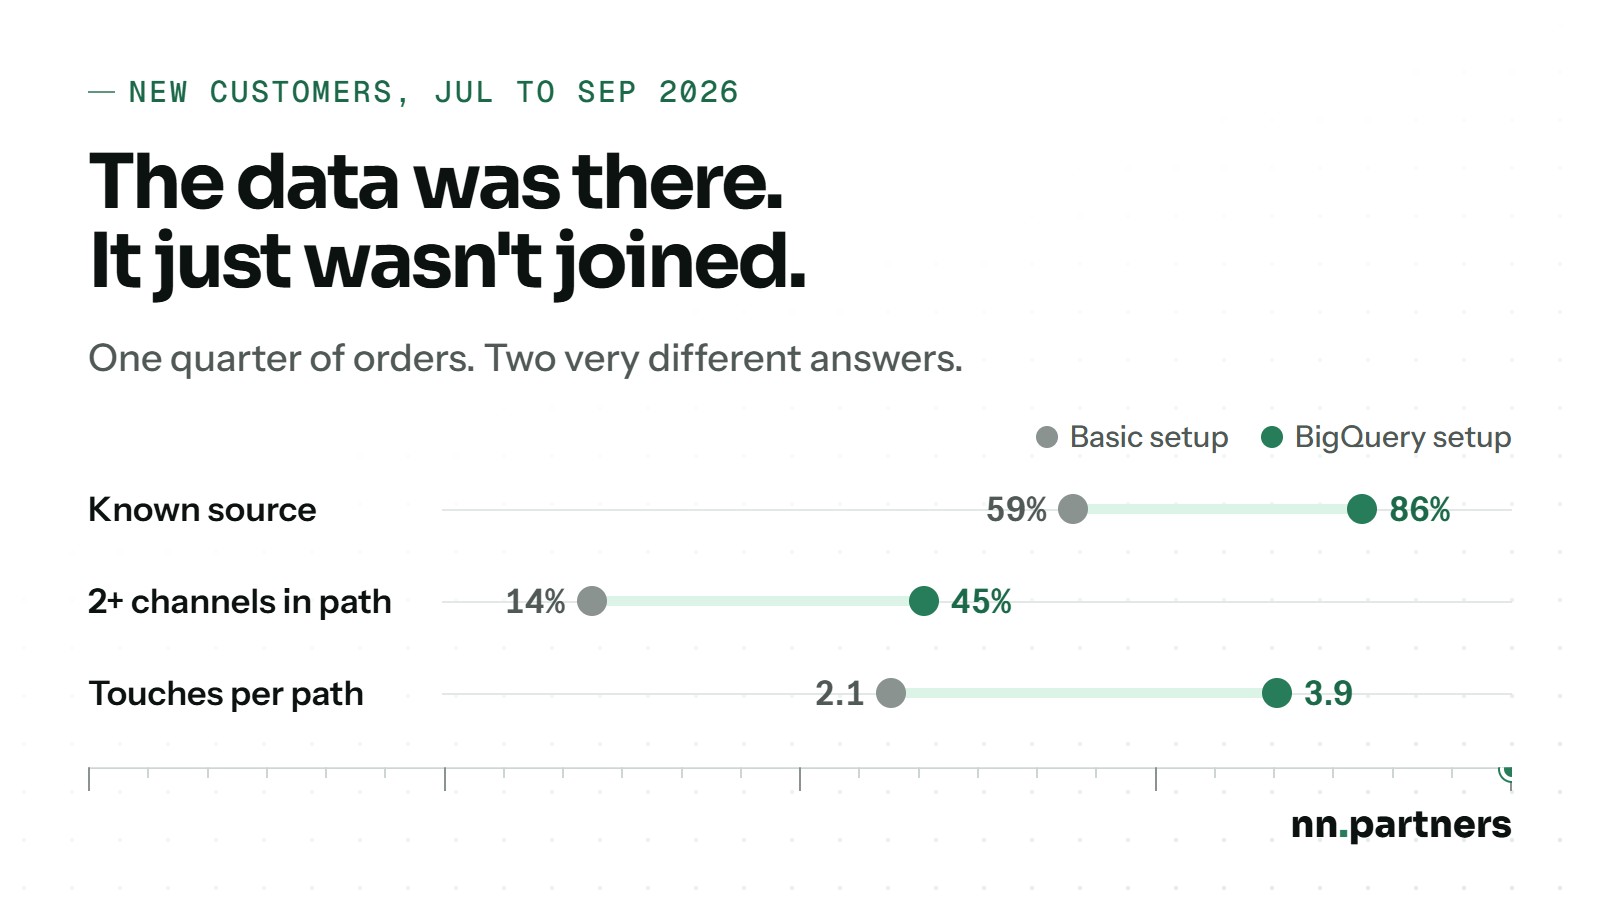
The gap between the two columns is the superpower. The basic web analytics setup (the GA4 export to BigQuery, collected server-side) sees what happened on the website. The advanced BigQuery setup holds everything else the business knows, and ties it back to those same web sessions.
What does a basic web analytics setup miss?

A quarter of this client’s new customers bought by phone, from a sales rep. In a basic web analytics setup, those orders don’t exist: no purchase event, no source, no path. They are offline conversions, and for this business they are a large share of revenue.
The web orders were not fully covered either. In the basic setup, one in five had no known source, and most paths showed a single channel, often the last one.
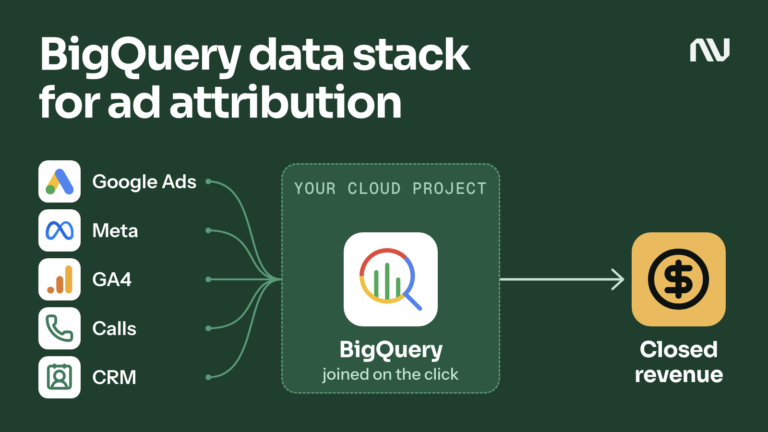
None of the missing data was lost. It sat in other systems: the CRM knew every order and who placed it, the call tracking tool knew every call, and the server container had seen every visit. What the basic setup lacked was the place where all of it meets.
The advanced BigQuery setup: data beyond the basics

The basic setup already lands the GA4 export in BigQuery. The advanced setup keeps any other data the business has next to it. Here that meant three extra sources, each joined to the same web sessions:
| Added in BigQuery | New customers’ orders with a known source | … of them bought by phone |
|---|---|---|
| Basic web analytics setup: GA4 export | 59% | 0% |
| + the server container’s own hit log | 75% | 46% |
| + calls and forms from call tracking | 81% | 68% |
| + the CRM’s record of the ad click behind an order | 86% | 75% |
The phone orders show how it works. A rep’s order has no web session of its own. But the customer usually left a trace on the site first: a form, a login, a brochure request. That trace carries the same email or phone number as the CRM order. Match the two, and the phone order inherits every visit that browser made before.
How one phone order gets its path:

- The CRM order’s email and phone match a form the customer filled in 12 days before the order, in one browser.
- That browser’s history holds a Meta ad 49 days before, another Meta ad 12 days before and a search ad 2 days before.
- The phone order now has every step before the call, and the basic setup saw none of them.
Calls themselves become one step in a path, not the whole story. In half of the phone orders where we saw both a call and an earlier touch, the channel that led to the call was not the one that brought the customer in.
What one place gives you
GA4, call tracking, the ad platforms and the CRM each hold a piece of the journey, and each reports it by its own rules. In the advanced setup, all of it sits together in BigQuery, in its original detail, under your control.
- The real order. Every path ends in the CRM order: its value, its product, who placed it, on the website or by phone.
- One customer, many ids. Browser ids, logins, emails and phones, click ids, joined into one person.
- Every step, in order. Which ad a customer clicked first, when they came back, when they called.
- History you can rebuild. Change a rule, such as the look-back window, and recalculate the whole quarter in minutes.
- A check on every claim. Each platform’s numbers compared with the real orders, order by order.
How server-side tagging keeps the path whole

A path is only as good as the visits it is built from, and the browser loses visits.
It catches purchases the browser misses. This client runs GA4 through a server container on its own subdomain (Stape). For new customers’ web orders, the server-side setup recorded 97.5% of purchases; the old browser-side tag recorded 89%. The browser tag missed 12% of Safari purchases and 6.5% in Chrome. Stape’s custom loader changes how the tag scripts load, so fewer of them are stopped before they run.
It keeps returning visitors recognisable in Safari. Safari shortens the life of cookies set in the browser, so a customer who comes back after a week can look brand new and their path starts again. Stape’s Cookie Keeper restores the marketing cookies from a first-party cookie the server keeps.
The effect shows in the buyers. Between September 2025 and April 2026, 21% of Safari buyers had a browser id at least a week old, against 31% in Chrome: a gap of 10 points. From July to September 2026, Safari rose to 26% while Chrome stayed at 31%. The gap halved, to 4.5 points.
It keeps the ids that join everything else. The server container writes every hit to BigQuery with the ids the standard GA4 export leaves out: the email and phone, the logged-in user id, the call tracking session id and Meta’s _fbc click cookie. For one in five orders with a Meta touch, that server-kept cookie was the only evidence of the Meta click.
One row per order

One new customer’s order on the website:
| When | Touch |
|---|---|
| 38 days before | First visit we can see, from an organic Google search |
| 8 days before | Clicked a Meta ad |
| 4½ days before | Clicked a Meta ad again, in a different browser on the same phone. We know it’s the same person because they logged in on both. |
| 3 days before | Searched the company’s name and clicked the ad |
| Order day | Searched the name again, clicked the ad and paid about $500 |
Google Ads credits brand search. Meta can credit itself too. The row shows four ad clicks and a journey that began 38 days earlier, with a search nobody paid for.
And one bought by phone, which the basic web analytics setup could not see at all:
| When | Touch | Seen by |
|---|---|---|
| 49 days before | Clicked a Meta ad | hit log, _fbc cookie |
| 12 days before | Clicked a Meta ad again and filled in a lead form | hit log, call tracking |
| 2 days before | Clicked a non-brand Google search ad | hit log |
| 17 hours before | Clicked a non-brand Google search ad | CRM |
| Order day | Called and bought from a rep | CRM |
What the rows showed

- The extra data changes the story, not just the coverage. In the basic setup, which sees web orders only, organic search and Meta looked like closers: they were more often the last touch than the first. In the advanced BigQuery setup, with phone orders and the extra sources added, both opened paths as often as they closed them.
- Brand search closes, sometimes. It was the last touch in 12.5% of new customers’ orders. Non-brand search appeared in 41% of paths, opening and closing in equal measure.
- Meta is also a phone channel. A Meta touch appeared in about one new customer’s order in ten, and a third of those customers bought by phone.
- Long journeys matter. The median path was 4 days, 11 for phone orders, but 28% started more than 30 days before the purchase and 9% more than 90. A 30-day window misses the customers who think longest.
Early days
Full server-side hit logging started in May 2026, and the orders here were placed from July to September. With a 120-day look-back, many paths reach back into months when most visits were not yet logged with an id. That means the earliest touches are the ones most likely to be missing, so treat which channel “opens” a path, and how long paths are, as lower bounds.
Every login, form, call and checkout ties one more browser to a real person, and that link works backwards for every visit the browser made before. Within this quarter the coverage held steady month to month.
What the recipe can’t see

Views. Video ads barely appear in the rows, while Google Ads credits video mostly with purchases from people who watched and never clicked. A row will never contain a view: measure video with a holdout test.
The last 14%. Some new customers never left an id we could join (or avoided tracking), and some really did come straight in.
Where do you start?
The ingredients are standard. The hard part is making them work together: connecting the data from every tool and making sure it is correct and complete. Every setup breaks in its own places, and you can’t see where from inside a report.
What a Data Audit tells you
- What you already have. Which data sources are in place, which are missing, and which are not connected.
- Where your path breaks. A score for each layer of your setup: events, data, integration and how the data is used.
- What to fix first. A prioritised list of fixes, most important first.
FAQ
We already send calls into GA4. Why do we need more?
Keep doing it. But a call in GA4 is a conversion event, not an order: one source, the last one, with no value, no product and no way to tell a new customer from an existing one. BigQuery ties the call to the real order and to everything the customer did before it.
Does Stape replace GA4?
No. Stape runs the server container that collects events and forwards them to GA4, Google Ads and Meta. GA4 still does the analytics; BigQuery holds the raw rows.
What does this cost?
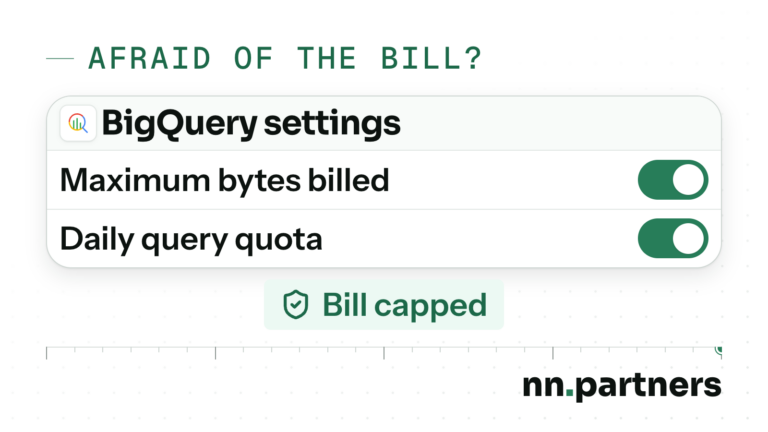
Running all queries to back up this case study with data cost under 20 cents. The ongoing costs are storage, the server container and the call tracking tool, and the larger one-off cost is building and checking the joins.
Do I need a data engineer?
To build it, usually yes, or a partner who has done it before. A Data Audit first shows how much of the work your setup actually needs.