If you run an online store and have ever opened GA4 expecting clear answers like:
- Where is our revenue coming from?
- Which campaigns are actually working?
- Who’s buying, and who’s bouncing?
…only to end up buried in tabs and guessing at the data, you’re not alone.
GA4 can be powerful—but it’s not built for business owners. It’s built for analysts. And if you just want to make smarter decisions, track performance, and scale profitably, the default GA4 experience leaves a lot to be desired.
That’s exactly why we at nn.partners built this ecommerce dashboard in Looker Studio.
It connects directly to your GA4 property and turns complex analytics into a clear, actionable report. Below, we’ll walk through each section of the report—what it shows, why it matters, and how it helps you run your business more effectively.
👉 Get the GA4 Ecommerce Report
1. Overview Page: Your Business at a Glance
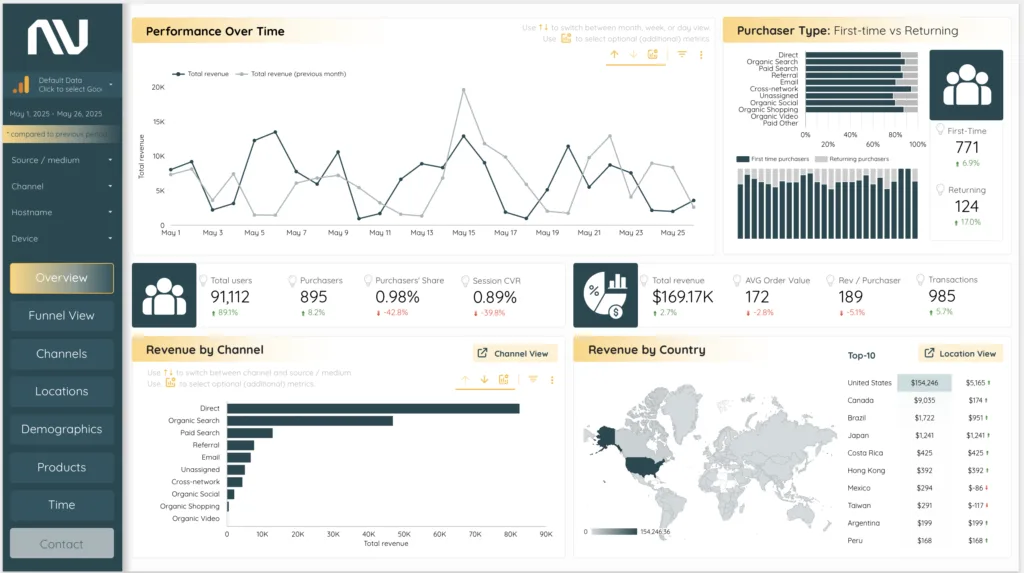
The Overview page gives you a fast, high-level view of your store’s performance—all on one screen.
It shows:
- Revenue trends over time
- First-time vs. returning customer behavior
- Revenue by channel and country
- Core KPIs including total revenue, average order value, and conversion rate
This is where most business owners spend their time. It brings your daily performance into focus and helps you understand what’s working and what’s not—without the need to jump between multiple GA4 tabs.
2. Funnel View: See Where You’re Sales Are Coming

Most stores have little visibility into how users move through the ecommerce funnel. The Funnel View changes that.
It shows:
- How many users are viewing products, adding to cart, starting checkout, and completing a purchase
- Where drop-offs are happening in the purchase journey
- Funnel performance broken down by traffic source, campaign, or device
This view makes it easy to see which acquisition channels drive buyers—and which just bring traffic that doesn’t convert.
You can quickly identify points of friction, compare performance across platforms, and focus your optimization efforts where they’ll have the biggest impact.
3. Acquisition View: Understand What’s Driving Revenue
This section shows where your customers are coming from and how different sources perform across the funnel.
It includes three core views:
Channel View
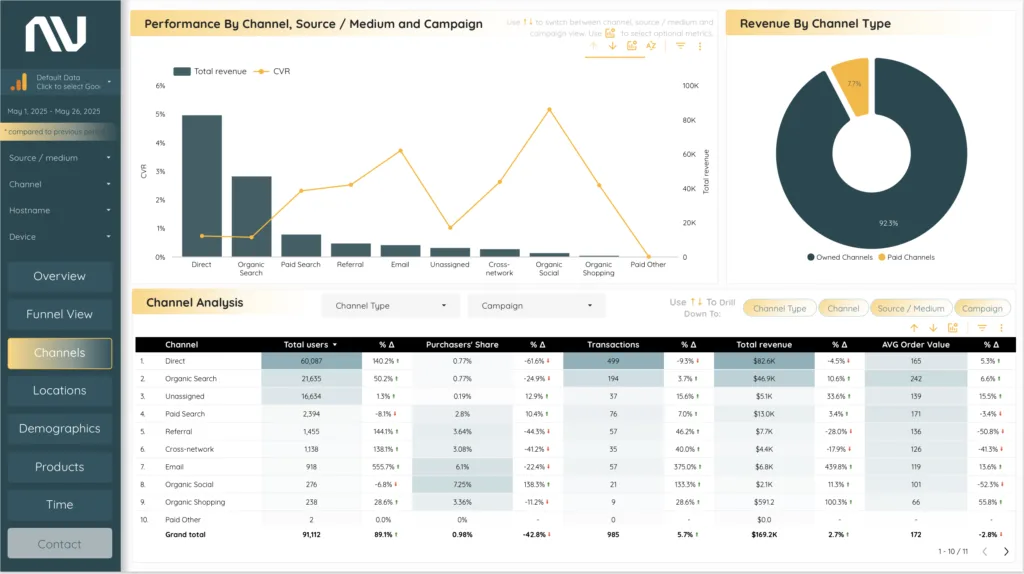
Compare revenue and conversion rates across marketing channels—paid, organic, social, email, and more.
Geography View

See which countries, regions, or cities drive the most value. Prioritize high-performing locations or explore untapped markets.
Demographics View

Break down revenue by age and gender to better understand your most valuable segments and tailor your marketing accordingly.
If you’re running multiple campaigns or testing new markets, this view helps you double down on what’s working.
4. Product Performance: Focus on What Sells
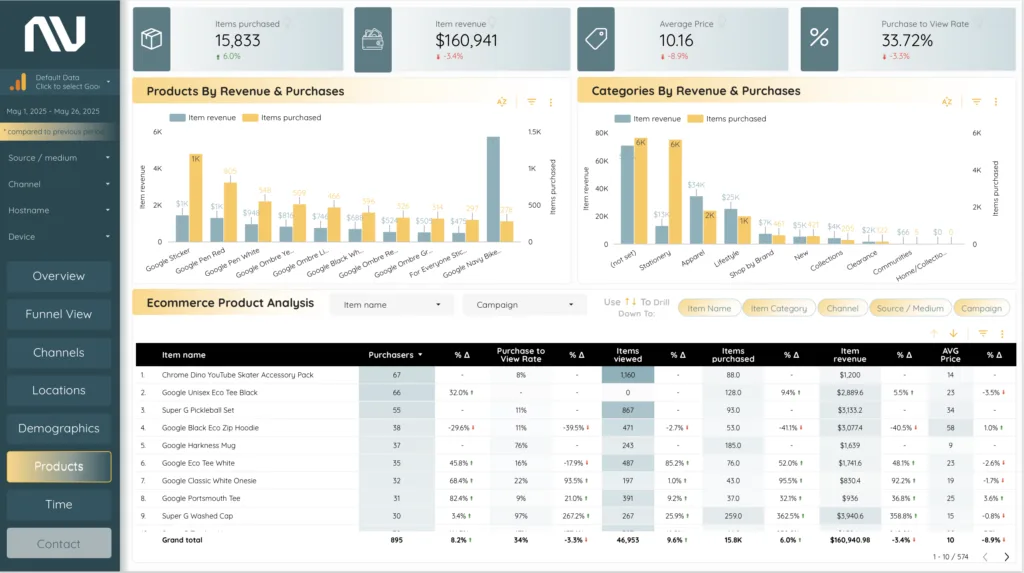
Not all products are created equal. This section helps you separate bestsellers from underperformers.
You can analyze:
- Top products by revenue and units sold
- Average product price and purchase-to-view rate
- Performance by campaign, source, or medium
This view supports smarter merchandising, ad planning, and product strategy. If a product gets lots of views but no conversions, you’ll see it. If a specific SKU is driving 80% of your revenue, you’ll know.
It’s how you shift from guessing to knowing.
5. Time View: Spot Trends and Plan Ahead

The Time page gives you a 12-month view of your store’s performance.
Use it to:
- Identify seasonal spikes and slow periods
- Understand long-term revenue and customer growth trends
- Analyze changes in order value and conversion rates over time
You can switch between daily, weekly, or monthly views and sort by different KPIs. This page is especially useful for forecasting and campaign planning.
What the Looker Studio Dashboard Solves (That GA4 Doesn’t)
This dashboard was built for decision-makers—not data analysts.
It solves the most common frustrations with GA4:
- Disconnected metrics
- Overwhelming navigation
- Inconsistent attribution
- Lack of clarity on what’s driving growth
With this report, you get a structured, revenue-focused view of your entire ecommerce performance in one place. No guesswork. No noise. Just actionable insights that help you grow.
How to Get Started
The ecommerce GA4 report is free and available now.
- Plug in your GA4 data source
- Start seeing your business clearly within minutes
- Use the insights to optimize performance, improve targeting, and make better decisions
If you need help with setup, we also provide a GA4 tracking guide and a comprehensive tracking framework to make sure your data is accurate and ready to use.
👉 Get the GA4 Ecommerce Report in Looker Studio
Final Thoughts
In a world where digital marketing is moving faster than ever, clarity is a competitive edge.
This dashboard brings clarity. It gives you control over your numbers, your funnel, and your growth—without needing to be a data expert.
If you’re ready to stop guessing and start making confident decisions based on your GA4 data, this report is built for you.
Let us know if you’d like help tailoring it to your store or walking through the setup. We built this for business owners—and we’re here to help.